Visit data and sales data become reporting.

Each check-out updates the dashboard: scheduled against completed, stores covered, photos per store, and where the shelf still has gaps. The store rating rolls the visit answers into one score per store. Reports are built from the same live data and sent on a schedule or on demand.

Inside rep activity

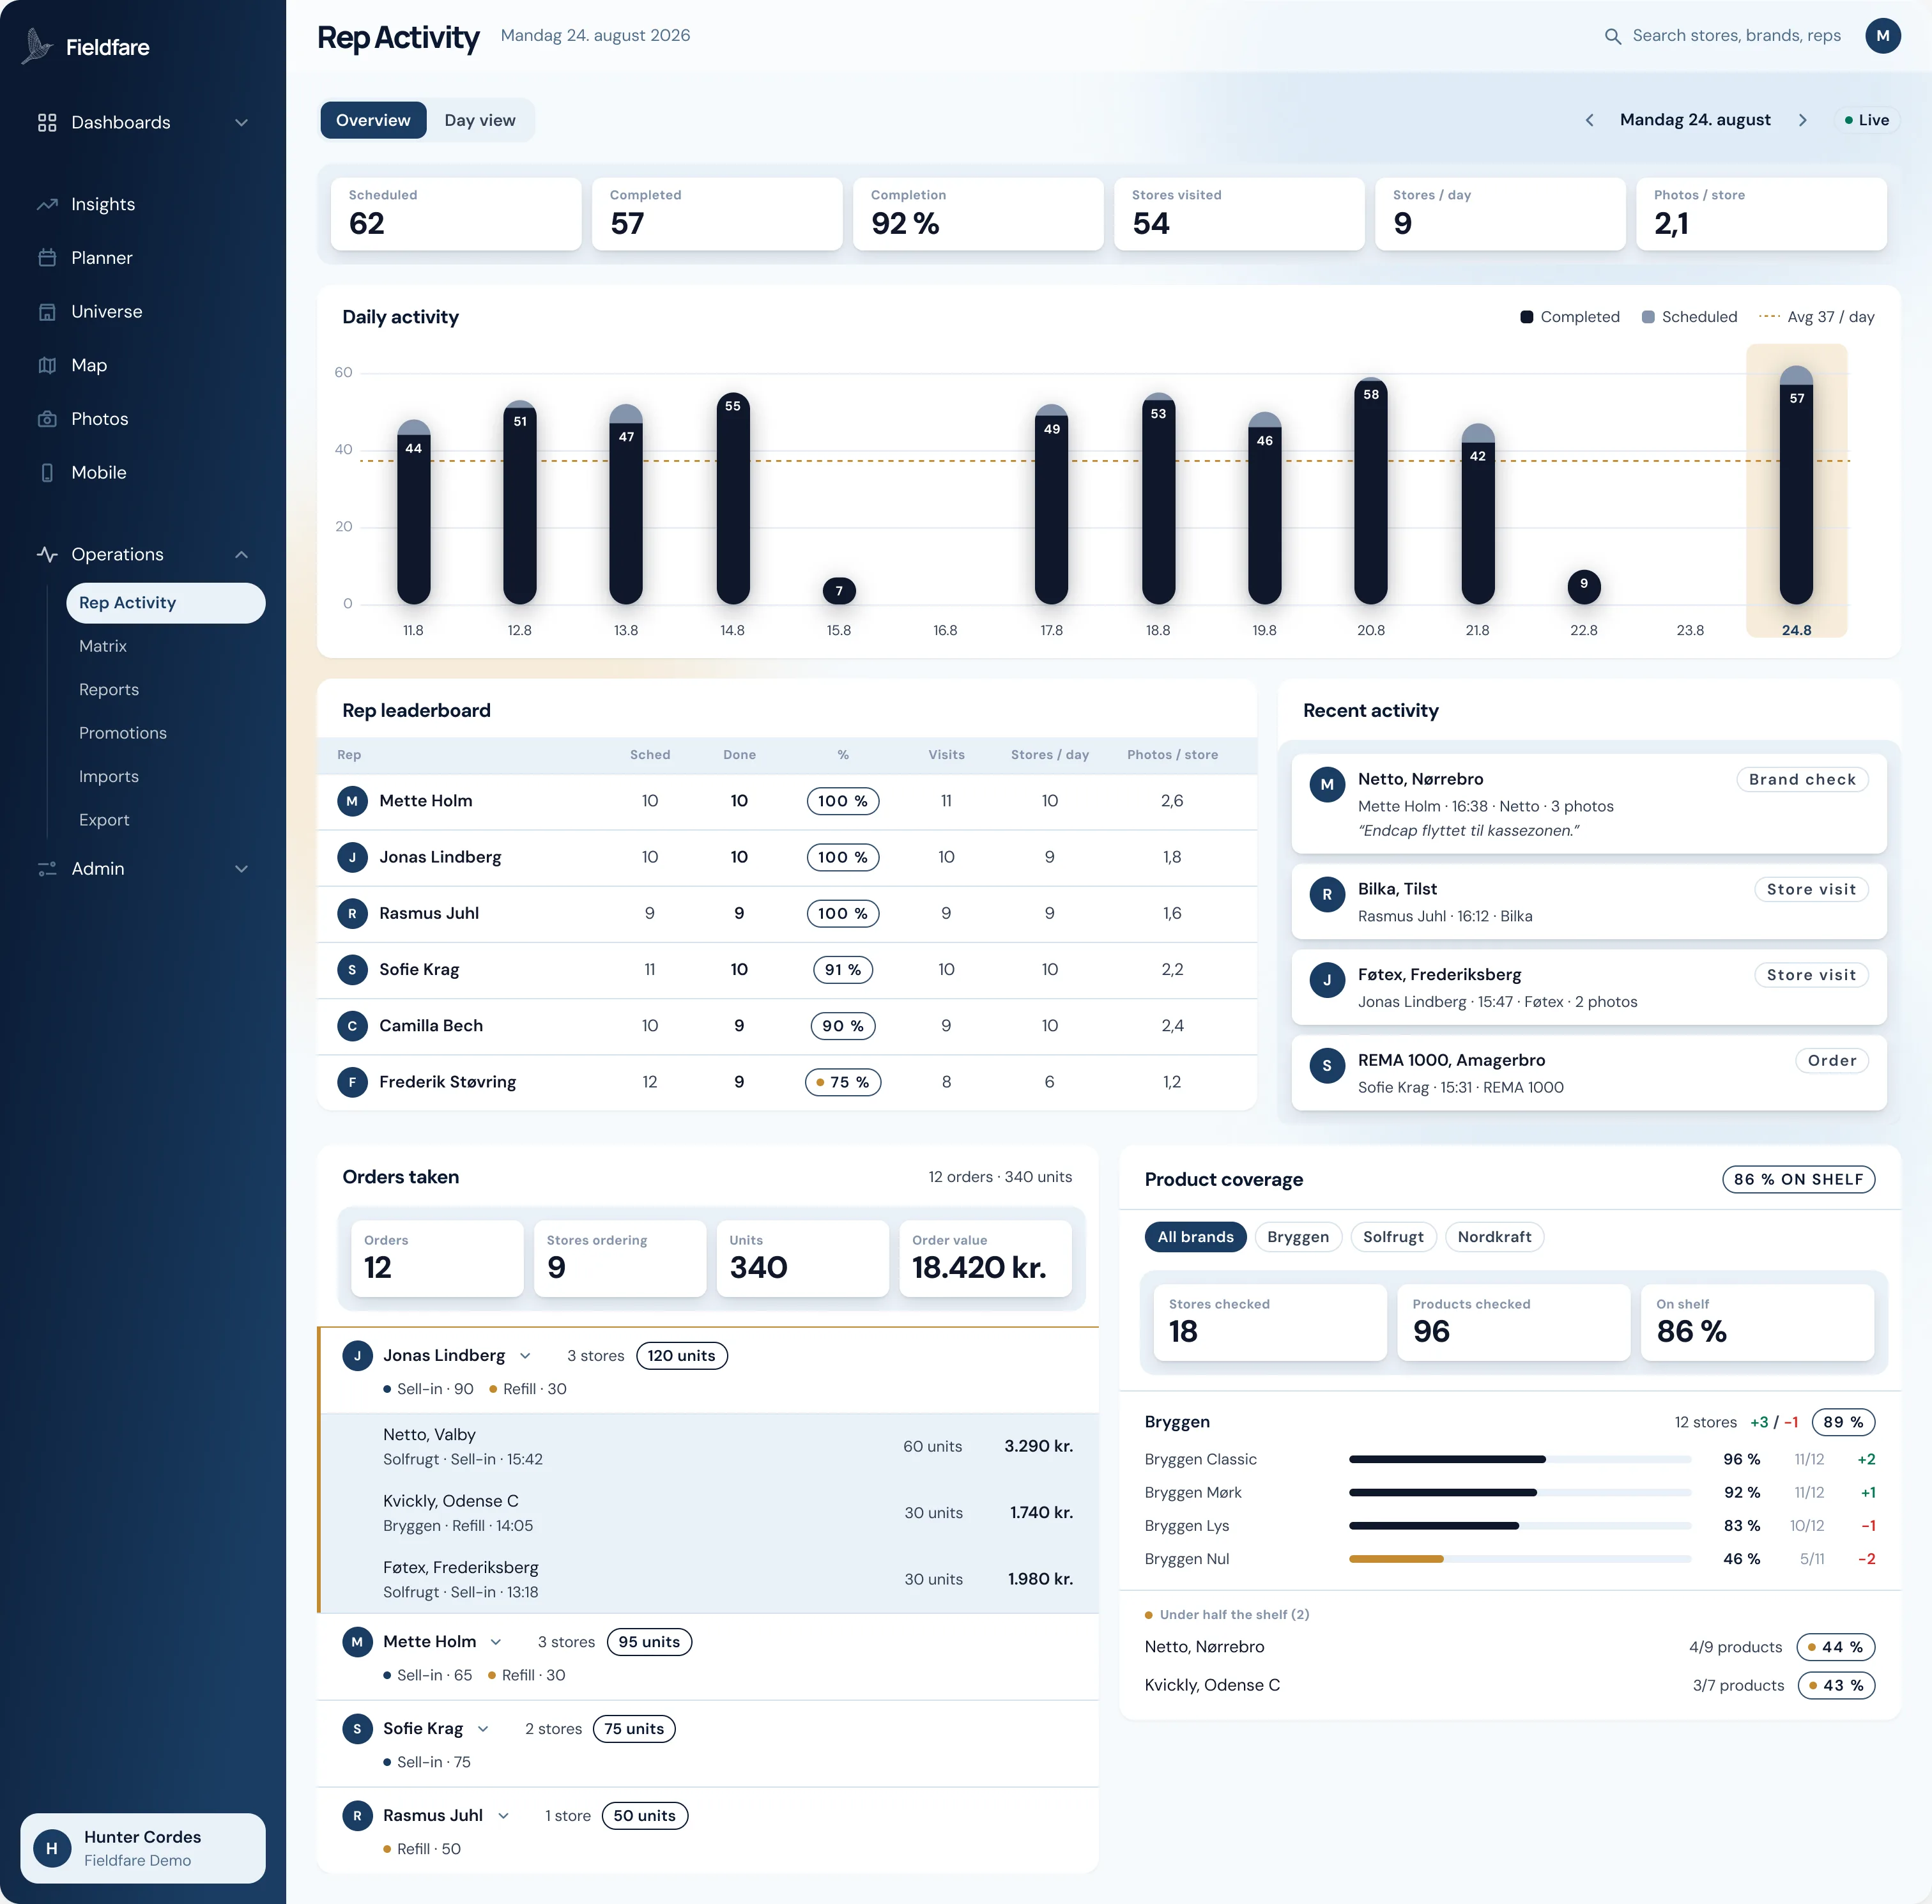
Scheduled against completed, per rep, per day.

Inside rep activity

Inside rep activity

  1. 01

    Scheduled against completed

    Scheduled against completed for the day, with the completion rate alongside. The numbers move as reps check out, so a slow day shows itself.

  2. 02

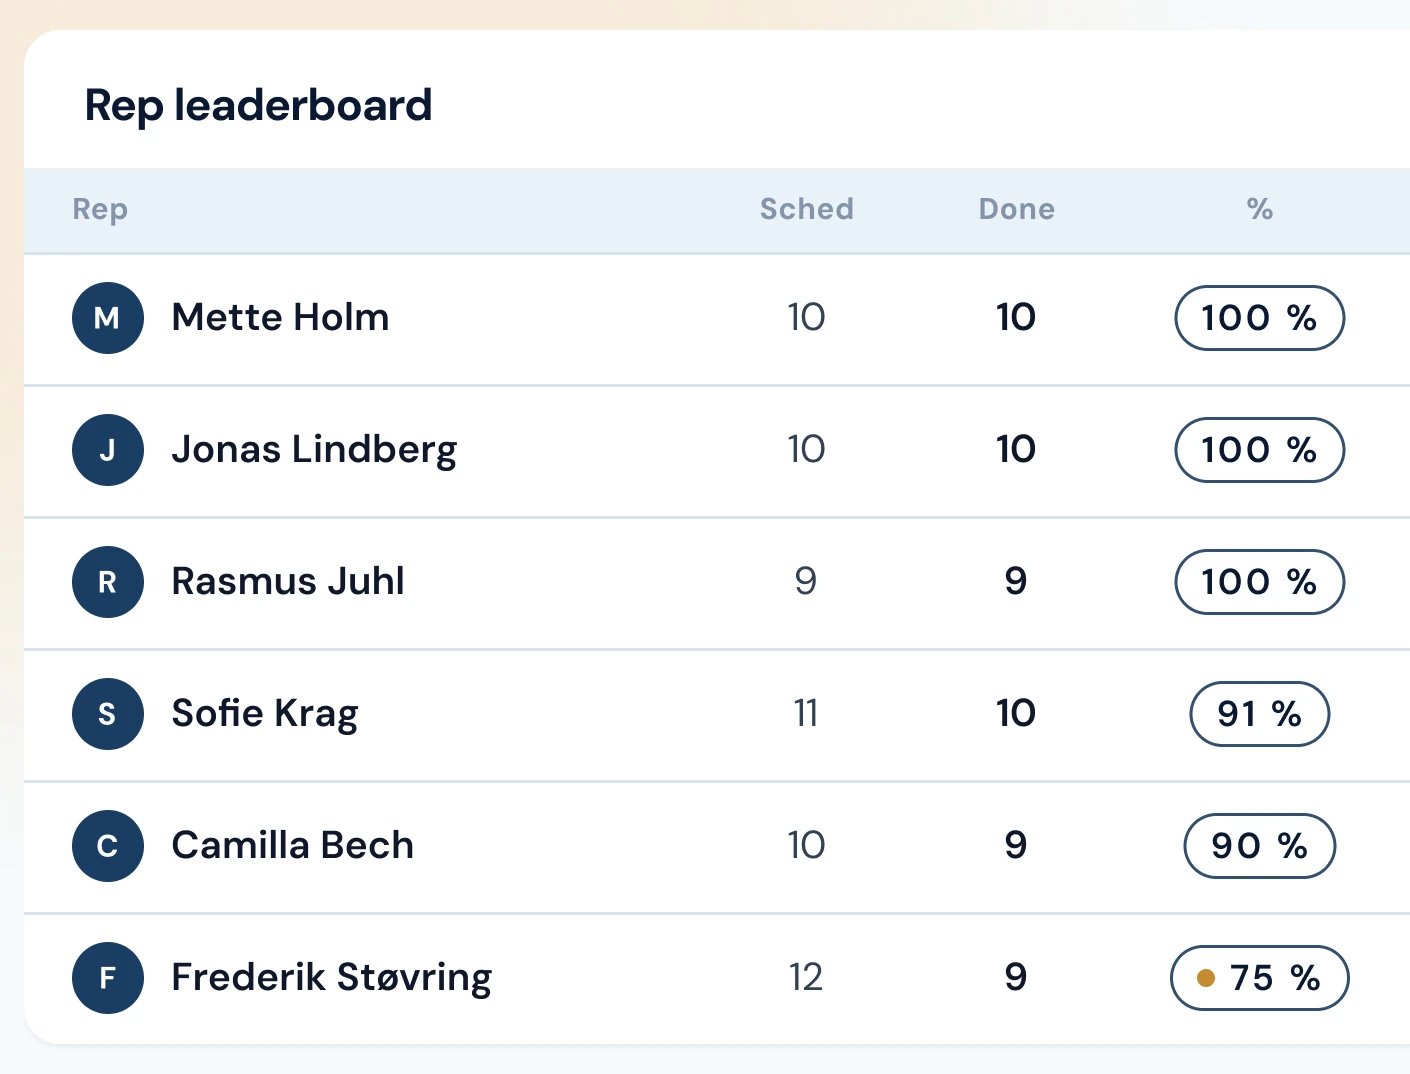
    One row per rep

    Scheduled, completed and the rate, one row per rep. The list makes the day comparable across the team, and the row that needs a call stands out.

  3. 03

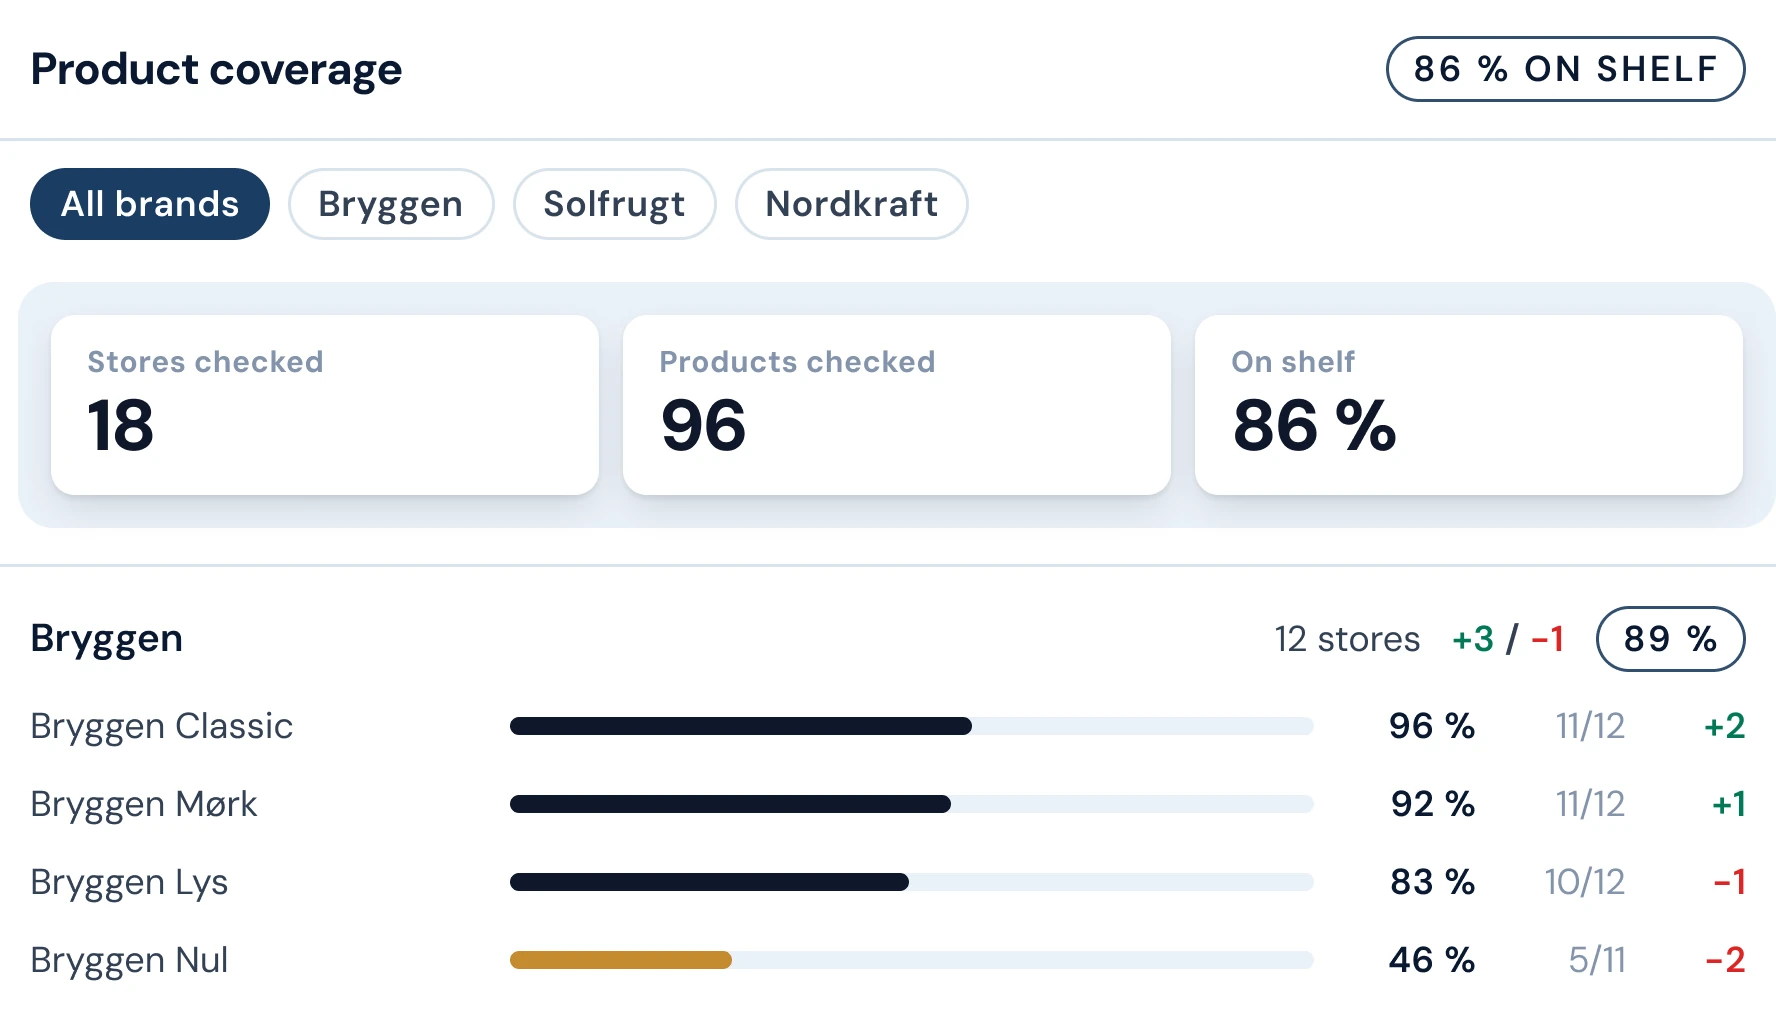
    Where the shelf is short

    Stores checked, shelf observations made, by brand and down to the single product. The gap reveals itself, so that effort goes to the right store.

Dashboards

The day in one view, live.

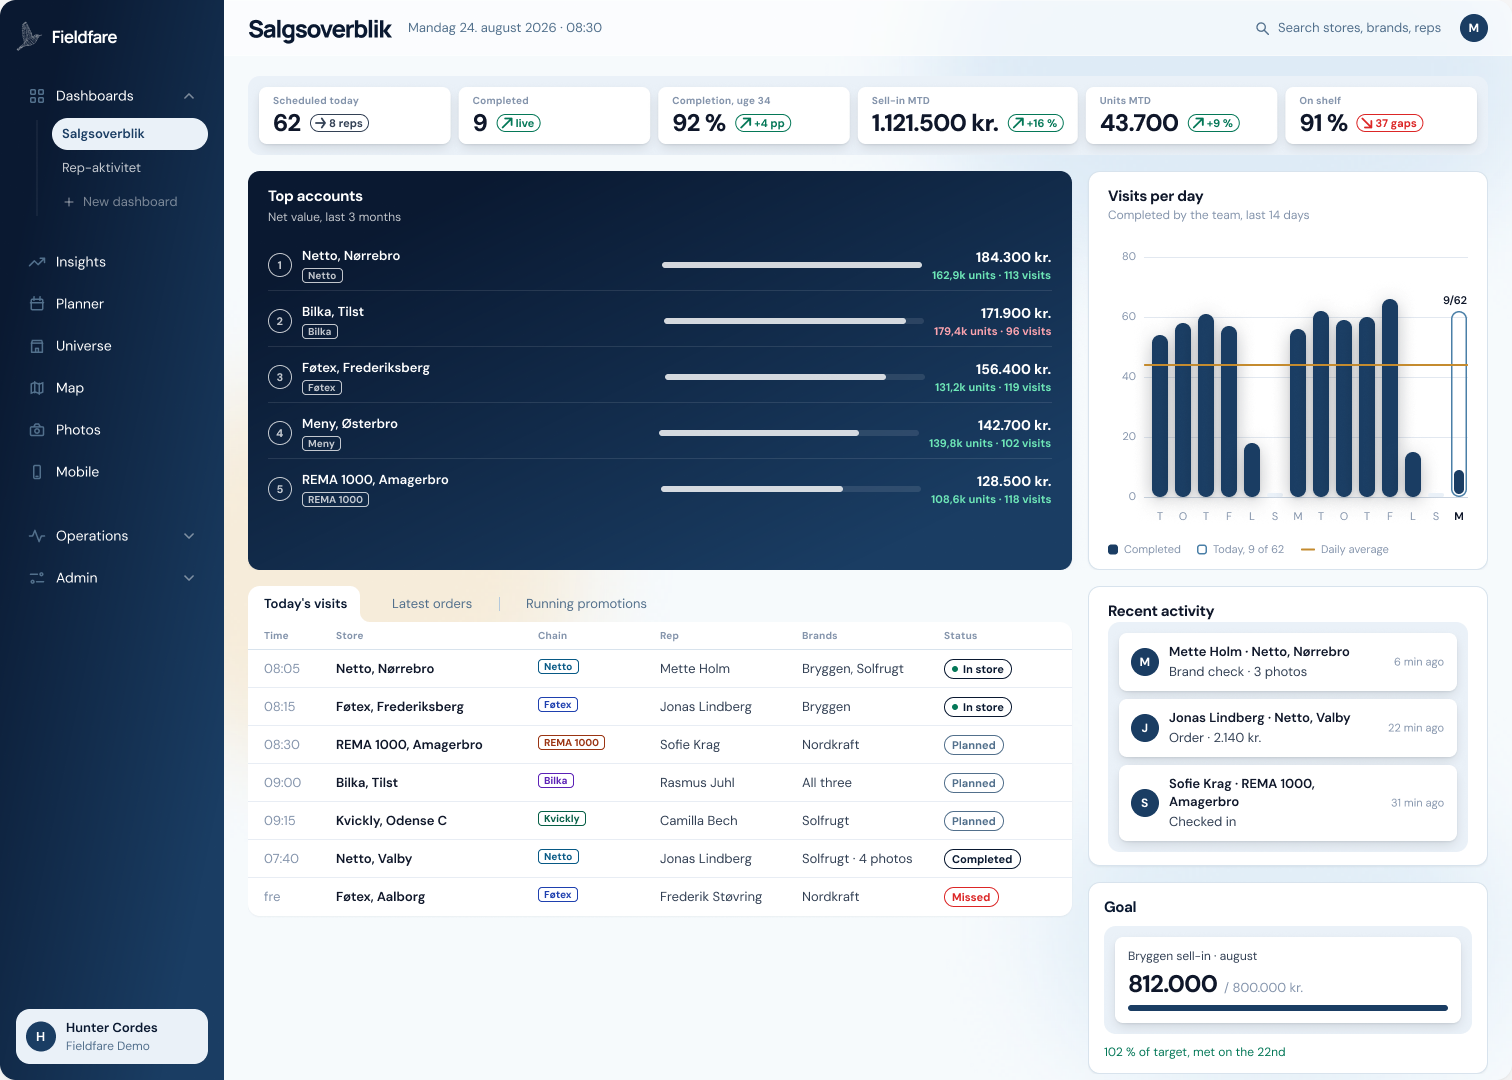
Salgsoverblik is the standing dashboard: top accounts, visits per day and sales by chain, updated the moment a rep checks out. The same numbers feed the weekly report, so your reports stay updated.

The day in one view, live.

Book a walkthrough.

Thirty minutes, your chains as the example. No slides.

Already on the platform? Sign in and enter your rep universe.